Showing posts with label Satellite Sensors. Show all posts

Wednesday, July 1, 2009

Downloading ASTER Data and More...

With all the recent media attention, it seems like it is best to wait a bit before trying to download any of the data. The Japanese site (ERSDAC) published a warning earlier today that downloads may timeout, and I had a challenging time even getting the USGS site to load:

I have mentioned this before, but here is a paper on hydrology/glacier mapping in the Tien Shan mountain range using both ASTER and SRTM elevation data. One of the benefits of ASTER and other satellite sensors is that they are very applicable to remote area mapping operations.

So while you're waiting for ASTER traffic to subside, why not check out the ASTER User Handbook? It contains a wealth of background information on the sensor, data products, processing, applications, and FAQs. Here it is:

Monday, March 30, 2009

North Korean Missile Site Images

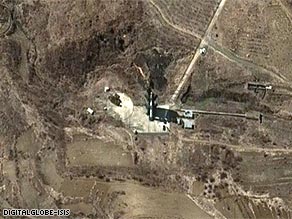
CNN ran an article today showing a DigitalGlobe image of the Musudan-Ri missile site.  The article is based on a report from the "Institute for Science and International Security," which has a number of related reports on their web-site.  The latest report contains annotated time sequence of both GeoEye and DigitalGlobe shots of the launch pad (DG images below):


March 24, 2009

March 27, 2009

Clearly things have changed at the site between images, but it is difficult to discern whether or not the rocket is on the launch pad or not.  The red circle depicts where the top of the missile should be.  

Tuesday, March 24, 2009

Processing GeoEye-1 GeoStereo Imagery in LPS

I mentioned last week that I would outline the workflow steps in LPS for creating terrain, orthophotos, and 3D vector data from GeoEye-1 GeoStereo imagery.


GeoEye-1 has both panchromatic (0.41 meter resolution) and multispectral (1.65 meter resolution) sensors, and I performed the processing with the panchromatic data because it is higher resolution. For this particular project I have RPC imagery (a single stereo pair) along with surveyed ground control points. Although the imagery is lower resolution than most airborne photography, one of the big benefits is that the image footprint is much bigger - this can dramatically decrease time and effort for certain parts of the workflow (e.g. mosaic seam editing).

In LPS the processing is straightforward: set up the project > measure ground control points > run automatic point measurement > perform the bundle adjustment > generate and edit terrain > perform orthorectification. 3D feature extraction can come anytime after the bundle adjustment is performed. What follows is an overview of the workflow. I won't go into the minute details but will cover the major workflow steps.

Block (project) setup is easy: just choose the model (GeoEye RPC) and then add the images in the LPS Project Manager. At this point processes like image pyramid generation can be performed as well.

A GeoEye-1 project in the LPS Project Manager

After the block is setup, the next step is to use point measurement in either stereo or mono mode to measure the ground control points. This is where we relate file/pixel coordinates with real-world XYZ coordinates from the GCPs. Typically this can be a time-consuming step but LPS has an "automatic XY drive" capability that puts you in the approximate area when you're ready to measure a point. After the GCPs are measured automatic tie point measurement can be run, which will generate tie points. Users have full control over the tie point pattern so there is a high degree of flexibility. After generating tie points, bundle adjustment can be performed in LPS Core. I won't delve into too much detail here, but this process involves running an adjustment, reviewing the results, refining if necessary, and then accepting the results once they are suitable. This is a critical step, because after triangulation we have our first data product: a stereo pair. Stereo pairs are crucial for 3D product generation, because XYZ measurements can be made from them. That means 3D terrain products and vector layers can now be generated.

Viewing a control point in stereo

The next step is to generate a terrain layer that can be used as a source during orthorectification, and may also be used as a product in it's own right. The Automatic Terrain Extraction tool in LPS can generate a surface and allow a high degree of control with regards to post spacing, filtering, smoothing, and more. In this example I used it to generate a 5 meter IMG grid, displayed below.

Terrain displayed in ERDAS TITAN

After performing terrain editing to create a bare earth DEM, I created an orthophoto from one of the 0.5 meter panchromatic GeoEye images. Terrain editing (in stereo) is important because surface objects such as multi-story buildings can introduce error into orthophotos if they are included in the terrain source. The orthophoto is displayed below.

Digital orthophoto in ERDAS TITAN

With a 0.5 meter resolution, it is also possible to extract 3D features such as buildings. I collected a few in PRO600 and then exported them to KML for display in GoogleEarth.

3D KML Buildings in GE

Note that other tools (in this case Stereo Analyst for ERDAS IMAGINE) can also be used for 3D feature extraction. Here is a building collected as a 3D shapefile with texture applied. Note that this is not generic texture, but rather the actual texture from the pan GeoEye-1 imagery. While it doesn't cover all facades, it does add a level of realism that adds to a 3D scene.

In summary, the process for created value-added geospatial data products from GeoEye-1 GeoStereo imagery can be accomplished by following the steps identified above. In a relatively short period of time, an array of 3D products can be derived that have value in a number of different applications. It will be exciting to see what kinds of applications come out of GeoEye-1 stereo imagery in future months and years!

Monday, March 16, 2009

3D GIS and GeoEye-1 GeoStereo Imagery

The notion of "3D GIS" has been gaining momentum in the geospatial industry for a few years now.  Witness the recent seminar conducted by the Britsh Columbia URISA chapter: "The New Dimension in GIS - 3D Analysis".  If the topic interests you, abstracts and many of the full presentatiosns can be downloaded from the site.  A look at the topics shows an examination of digital cities, 3D models, BIM, LIDAR, digital orthophotos orthophotos and more.  The industry has been abuzz with the integration of GIS, photogrammetry, and remote sensing for some time now, but only recently have the data products and tools have matured to the point of making integrated 3D GIS applications a reality.

Satellite imagery providers that have stereo collection capabilities are a good example of the drive to generate 3D data products.  As I've commented previously, the lack of industry standards for photogrammetric metadata poses a challenge to offering stereo products - but this is changing with data vendors pushing stereo products forward and efforts at the OGC-level to drive standards. An interesting item from Matt Ball's summary of the recent ASPRS conference in Baltimore was the keynote presentation from John R.G. Townshend, "calling for the standardization of imagery metadata".

GeoEye packages their satellite imagery products in a few different categories: Geo, GeoProfessional, and GeoStereo.  As stated on the GeoStereo product page, "the RPC camera model supports block adjustment, three-dimensional stereo extraction, DEM generation, ortho-rectification, and other photogrammetric operations. "  

GeoEye-1 Stereo Imagery in LPS

The benefit of stereo imagery is the value-added geospatial information that can be derived from it.  The quote above relates three specific data products: digital orthophotos, terrain models, and 3D vector data (three-dimensional stereo extraction).  Digital orthophotos have become a standard component in base map data, and can be used for accuracy assessment (e.g. are the vector data layers complete and correct?), 2D vector digitizing and update, change detection, and a number of other applications.  Terrain data, which can be automatically generated, is a key component for orthophoto generation, and is useful for a wide variety of other applications as well. The other data product mentioned above is 3D vector data.  One of the major benefits of stereo imagery is the ability to measure objects in X, Y, and Z and collect 3D vector data.  Not only can the vector data be extracted in XYZ, but the objects can be accurately extruded down to the ground level.  This provides a 3D object that can then be attributed, textured, and then fed into a variety of applications.   

Since we recently received GeoEye-1 GeoStereo imagery for validation in LPS, I thought it would be worthwhile running through the workflow in LPS 9.3.1.  In the next post I will outline the workflow steps - with the right set of tools, developing the products outlined above is a very straightfword process!  

Wednesday, March 4, 2009

Sensor Spotlight: GeoEye-1

With all the recent news about NGA certification for GeoEye-1, I thought I'd write a post on it. Aside from usage in Google Earth, there's also been recent coverage on GeoEye imagery being used in a new video game from Ubisoft. Check out the YouTube video of the game below. There's an interesting dialog about using stereo imagery for gaming as well, which makes sense considering terrain, buildings, and image texture can all be derived from the GeoEye stereo products.


As for the details, sensor specs are available on the GeoEye website here. The pan sensor has a resolution of 0.41 meters and the multispectral sensor has 1.65 meter resolution. The swath width is 15.2 kilometers and at an altitude of 681km the revisit time is less than three days. GeoEye also maintains a great looking gallery of images from the sensor here.


Back in September I discussed the launch site set-up by GeoEye for streaming video of the launch. This is now available on YouTube as well:


We added support in LPS for the GeoEye-1 rigorous and RPC sensor models back in LPS 9.2, and it is also available in the current 9.3 version. GeoEye has also recently provided us with sample data for accuracy testing and validation. Early results are looking good and I will post an update when we're a bit further along.

Sunday, January 25, 2009

Low-Cost Satellite Mapping

An article on BBC News website from Thursday outlines a company, Surrey Satellite Technology Limited (SSTL), that plans on developing a sensor capable of sub-meter resolution. I don't see any mention of a timeline or any information on the SSTL web-site, but the news article claims the new system is calleld ART (Accuracy, Reach, Timeless).

With a price tag of $70 million it still isn't "cheap", but it is considerably less than than the $500 million it cost to build and launch GeoEye-1. Considering NGA paid half the cost, a low-cost system may make satellite remote sensing more commercially viable. Hence, it the news that SSTL has been purchased by EADS Astrium doesn't come as a surprise.

This is certainly a development to keep an eye on, as the project will have a great shot at success if the the lower development and launch costs translate into lower data costs for consumers.

Monday, November 10, 2008

Chandrayaan-1 Moon Probe

I've seen a lot of mainstream media coverage of India's Chandrayaan-1 moon probe recently. The significance for the mapping community is the mission goal of creating a 3D lunar surface model.

This page on the Indian Space Research Organization's site outlines the specifications of the various payloads:
1) Terrain Mapping Camera (TMC)
2) Hyperspectral Imager (HySI)
3)
Lunar Laser Ranging Instrument (LLRI)
4) High Energy X-ray Spectrometer (HEX)
5)
Moon Impact Probe (MIP)

Of particular interest are the TMC and the LLRI.

The TMC will have a 5 meter spatial resolution and pushbroom sensors in forward, nadir and reverse directions. This will allow for stereo data collection that can be used for topographic mapping applications. A concise summary document is here, which I would recommend for anyone interested in the topic.

The LLRI will is an excellent complementary sensor to the TMC, and as one would expect from the name, is essentially a on-board LIDAR sensor. A summary document is available here.

It is also interesting to note that the Chandrayaan-1 mission is the first in a series of five planned missions. These are all outlined on the ISRO page here.

It'll certainly be interesting to see the data products Chandrayaan-1 will produce. To my knowledge this is the first lunar mapping project since the Clementine mission in 1994, which collected much of the lunar surface at 7-20 meters GSD with it's camera (not in stereo, I believe). LIDAR data was collected during that mission as well.

Wednesday, November 5, 2008

Sensor Spotlight: CARTOSAT

Today's post will highlight the CARTOSAT-1 and CARTOSAT-2 sensors. CARTOSAT-1 was launched in 2005 and features two panchromatic cameras for stereo imagery capture. The cameras cover a 30 meter swath and the resolution is approximately three meters. Many of the sensor features and are located on the ISRO site here. For a good white paper on CARTOSAT-1, presented at the ISPRS conference in Beijing, see here. The authors outline the processing workflow for CARTOSAT-1 data in LPS, consisting of setting up the orientation, performing automatic terrain extraction, and finally orthorectifying the images. While the processing was performed on CARTOSAT-1 data, the workflow would also be very similar for CARTOSAT-2.
The paper highlights some software improvements we implemented between LPS 9.0 and 9.2 SP1, as some of the initial processing was performed in LPS 9.0. The improvements specifically pertained to the LPS ATE (Automatic Terrain Extraction) module, where we added quality improvements in the correlator. The authors found the ATE results with LPS 9.2 SP1 to be acceptable, with errors general under 2m. It is also important to note that we made Adaptive ATE available for satellite sensor models with the recent release of LPS 9.3, so I suspect the accuracy could even be further improved.

Here is another ISPRS paper from 2007 outlining some advances in CARTOSAT-1 data processing. It also highlights the use of LPS for the terrain processing component of the workflow.

CARTOSAT-2 was launched in early 2007 and also features two panchromatic sensors, featuring a greatly improved resolution of under one meter. A spec sheet from ISRO is here. The wikipedia article makes some interesting statements about resolution (80cm) and pricing, but I haven't been able to verify these statements. This paper, also from the ISPRS conference in Beijing, has some great information on both satellites, as well as some further details on the terrain processing workflow. LPS was used as well in this paper, although it does not state the version number.

Note that in addition to using LPS ATE for automatic terrain extraction, the LPS Terrain Editor can be used to view the imagery in stereo and perform interactive terrain editing (from manual compilation to editing an automatically correlated surface).
Note that in addition to the CARTOSAT-1 and 2 sensors, there is also a CARTOSAT-2a sensor that is reserved for military usa.

Thursday, October 9, 2008

Satellite Archeology with Quickbird

Check out this article from MSNBC for an interesting application of remote sensing. The article highlights the fact that remote sensing can be an excellent tool for locating historical sites that cannot by detected by ground. The arrows in the image below show the outlines of the pyramids.

If you're interested in this topic, here is an excellent paper by Dr. Armin Gruen from ETH on "New Technologies for Efficient Large Site Modeling."

Monday, September 1, 2008

Upcoming GeoEye-1 Satellite Launch

The GeoEye-1 satellite launch on September 4th has been getting a lot of media attention lately. Instead of regurgitating the specs, I'll focus on a few other details.

First of all, check out the Launch Site here. It has a count-down and informs us that there will be a live video stream of the launch - should be interesting to watch.

There were several reports today about a deal between GeoEye and Google, whereby Google will be the exclusive online mapping site with access to the imagery.

Note that LPS will support both the rigorous and RPC models for GeoEye-1 in both LPS 9.2 (the current version) as well as LPS 9.3 (coming soon, stay tuned).

Friday, August 15, 2008

Sensor Spotlight: Thailand Earth Observation System (THEOS)

You might have noticed that last year we released a PR regarding support for the THEOS sensor model in both LPS and ERDAS IMAGINE, which was due to launch last week. Unfortunately the satellite launch has been postponed, but we're looking forward to a successful launch once the new date has been set.

A THEOS engineer, Suwan Vongvivatanakij, put together an excellent overview presentation for the CEOS Working Group on Information Systems and Services (WGISS) for their meeting last February. I haven't seen a lot of detailed information about the satellite on the web and thus far this is the most comprehensive info I've seen.

The satellite has panchromatic and multispectral modes, with a 2 meter resolution at nadir for panchromatic and 15 meters for the multispectral mode. For mapping, stereo applications will be supported since there are three (forward, nadir, reverse) look angles.

If you hail from Thailand (or can read Thai) you can see the THEOS program homepage here: http://theos.gistda.or.th/home.html

Monday, August 11, 2008

DigitalGlobe on NBC: A Closer Look at 3D Olympics

I've seen a couple of posts regarding DigitalGlobe's Bejing Oympic Games coverage. In my opinion this is a great consumer-grade marriage of geospatial technology and mainstream media. On the DG homepage "DigitalGlobe on NBC" is prominently displayed, which takes you to http://www.digitalglobe-aegistg.com/, their site with EAgis Technologies (a joint effort between DG, EAgis, and NBC).

The posts above comment on the technological underpinnings on the 3D scenes offered on the new site. One common theme is how a combination of different technologies (photogrammetry, 3D modeling, satellite imagery, 3D visualization) can be used together to provide a powerful and immersive viewing experience.

The http://www.digitalglobe-aegistg.com/ site allows visitors to download 3D PDFs, a KMZ and perspective views of various Olympic sites. 3D PDFs have been around for awhile, but this is the first time I've had a chance to examine one: very cool, although not the same experience as a KML file in a virtual world. Compare for yourself below:

KML in Google Earth:

3D PDF:
Aside from the availability of 3D example data, the site also provides some insight into the creation of the dataset. The "How Can This Be Possible?" heading expands to provide a high-level introduction to the technology and workflow. The workflow is divided up into four parts with a graphic associated with each one: the "3D wireframe" generation, imagery capture, feature extraction and extrusion, and fully textured 3D model generation.

"3D Wireframe" Generation

The site mentions that the wireframe represents the earth's terrain, and that it was derived from two DG satellite images. Sounds like classical photogrammetry! Two images associated with sensor model can be viewed in stereo to extract (measure) 3D positions (e.g. points with an accurate XYZ location). For high-accuracy applications relying on the satellite sensor model may not be enough, and there would be a need to collect and measure ground control points and then run through the triangulation process. However, once that is done there are numerous applications that may be used for terrain extraction.

The screen capture of the wireframe is actually a Triangulated Irregular Network (TIN), which when compared to raster DEMs is a more efficient means of modeling terrain. These can be automatically correlated using point matching algorithms or manually compiled by hand - which can be a very time-consuming process.

Why is the TIN important? The terrain represents a fundamental part of an immersive 3D scene. If it isn't accurate then the scene will not look realistic... In inaccurate terrain model could also cause problems in the image processing (orthorectification) part of the workflow.

It is also important to note that terrain can come from a number of sources: manual compilation, automatic correlation, LIDAR, IFSAR, and other sources.

Imagery Capture

This screen capture shows imagery draped over the terrain. The imagery would have come from QuickBird or WorldView-1 satellites. For a good-looking scene high-resolution satellite imagery or aerial photography is important. Sometimes satellite imagery is useful, but often aerial photography is the best solution. Why? If imagery is captured from a sensor mounted on a plane, the data acquisition organization has full control over the scale/resolution of the photography. Flying low equals higher resolution...

Another important note is that the terrain model discussed in the previous step would likely be used to orthorectify the image. This will result in a geometrically accurate orthophoto with real-world coordinates. The accuracy of the terrain is important: if there are large errors the 3D features discussed in the next step may not appear in the correct position if they were extracted in a stereo feature extraction system (building footprints digitized off the orthos and then extruded would be ok though).

Feature Extraction and Extrusion

The text for this segment talks about "special tools" being used to determine "footprints" of buildings and then extruding them. This might work for some rectangular buildings with flat roofs, but it is clear that all the download-able content on the site was not derived from automatic extrusion. There are a couple of ways to generate 3D buildings. The quick an dirty way (extrusion) involves digitizing the building footprints in 2D from a digital orthophoto. Then you need to tag the building polygon with an attribute to represent height. This is a fairly straightforward procedure if a digital surface model (DSM) of the area is available. The drawback of extrusion is that, although quick, it may not be accurate. Extrusion assigns one elevation value for the entire building (roof) area, so buildings with pitched or complex roof structures will not be modeled accurately.

Photogrammetric feature extraction can model buildings with greater detail, since specific building detail can be modeled in stereo by viewing and measuring buildings in 3D. However, photogrammetric feature extraction is performed from a "top-down" perspective, so features like balconies may be difficult to model. This is where CAD or CAD-like 3D modeling packages and ground-based photography can help. One workflow for 3D city construction is to photogrammetrically extract the buildings and then import them into a CAD package to add more detail to the models. Ground photos can also provide photo-realistic image texture, as can aerial photography, but capturing all four sides of a building can be difficult without planning the acquisition flight with a very high degree of overlap - which can add to the project cost (more fuel, more data to process). In addition, aerial photography may not be able to capture street-level image texture or areas with dense skyscrapers.

At any rate, there are many ways to go about generating the 3D buildings - it all depends on the level of detail required and the project budget...

Textured 3D Model Generation

As I mentioned above, texture can be applied to buildings from both ground and aerial photography. There's a number of tools that can be used to texture the buildings, here is an example video of how this can be done in SketchUp. There's a number of 3D modeling applications out there to do this sort of work. Again, production costs rise an accordance with the level of detail applied to a building. A "perfect" building cannot be easily automated and can be laborious to produce in sophisticated packages such as Autodesk's 3ds Max.

Looking at the Beijing Institute of Technology model it is clear that a lot of effort went into building it. Not only does the texture look great, but there is a lot of 3D modeling that has been done in a professional 3D modeling system. The rounded rooftop would be very difficult to model in a photogrammetric feature extraction system, and the model contains detail of the roof overhangs - which would likely come from the use of ground photography.

At any rate it is nice to see this technology getting some mainstream media coverage. Photogrammetry and 3D mapping have been around for a long time, but the mass-market popularity of visualization packages such as Google Earth is exposing this technology to a much broader audience.

Monday, May 26, 2008

Sensor Spotlight: WorldView-1

WorldView-1 is a satellite sensor that was launched in September 2007. Built for DigitalGlobe by another Colorado-based company called Ball Aerospace & Technologies Corp, the satellite is in orbit at an altitude of 496 kilometers. There's a great gallery of the construction of the satellite here.

There is a specification sheet on the DG website that highlights the features and benefits of the sensor. WorldView-1 is a panchromatic sensor that features a 0.5 meters GSD at nadir and 0.59 meters at 25 degrees off-nadir. This makes it one of the highest resolution commercial remote sensing satellites on the market today. See a gallery of imagery here.

Imagery can be purchased at various levels of processing. These include:

Basic: the imagery is provided with a camera model and radiometric/internal geometry distortions are removed.
Standard: georeferenced imagery (but not orthorectified).
Orthorectified: 0.5 meter panchromatic orthos.
Basic Stereo Pair: the imagery has orientation information that allows for 3D content generation in a photogrammetric system.

These products give consumers a lot of freedom in determining the best solution for them. For example, if you want complete control over all the photogrammetric processing, then the Basic product will be the best choice. For GIS users that want an imagery backdrop for their application, the orthorectified product is a good option. For users that don't have any ground control (for triangulation) but still want to extract 3D information in a photogrammetric system, the Basic Stereo Pair is a good solution. This option is also good for remote areas where collecting ground control is difficult, expensive or dangerous.

We added support for WorldView-1 data in the LPS 9.2 release, which will support all the products mentioned above. Specifically, you could use LPS to triangulate the imagery, adjust the radiometry, extract and edit terrain, extract 3D features, create orthophotos, and create final image mosaics.

Lastly, for more information on satellite photogrammetry check out this article in the Earth Imaging Journal. It is written with IKONOS imagery as the example but is applicable for Worldview-1 data processing as well.

Saturday, April 12, 2008

Accessing GeoBase Web Services

GeoBase, the Canadian government portal for free geospatial data, has made several GeoBase layers available as OGC-compliant WMS'. It is also worth noting that the data is free from most restrictions, as stated in the license agreement.

One of the new features in ERDAS IMAGINE 9.2 is the GeoServices Explorer. It is a new way to access web mapping services from desktop versions of IMAGINE and LPS.

Once you login to GeoBase, accessing their WMS layers is pretty straightforward. They send you the WMS service URL in an email, and that's all there is to it... In IMAGINE it is fairly simple to connect - just open a viewer, hit the "open layer" icon, choose a Web Mapping Service in the file type, and then hit the "Connect" button on the bottom right hand side of the interface.

After you hit the "Connect" button the GeoServices Explorer will open (see below). This will list all the WMS layers you can connect to once you have added the GeoBase services. There is a huge wealth of information available in GeoBase. The only thing I couldn't find that I had been hoping for was the SPOT 4/5 data that was made available for download earlier this year. I was able to download the SPOT data but unfortunately just didn't see it as an available layer to connect to...
In the example below I connected to the Canada-wide AVHRR composite - which was a breeze to connect to and display. It was also easy to display other layers such as roads and cities. They also have several layers outside Canada, covering the US, parts of Africa, and a few global datasets. I've included a screen capture of the IMAGINE viewer with the AVHRR data loaded in it.